
By Chihiro Kai. Edited by Jake Adelstein
Suddenly, Japan which was facing a severe fourth wave of coronavirus infections, serious illnesses and death seems to be out of the woods! The number of prefectures (Japan’s equivalent of a state) that were ranked as having the worst coronavirus infection category have suddenly dropped in half. Just in time for the Olympics!
However, things are not quite as they seem. The number of prefectures under Japan’s severest coronavirus infection category dropped AFTER the Ministry of Health, Labor and Welfare revised its method for calculating hospital bed occupancy rates. Japan has a long history of solving problems by lying about the numbers or altering standards to cover the problem.
Two months after the nuclear meltdown in Fukushima in March 2011, the Japanese government raised the allowable exposure to radiation from 1 mSv annually, an international benchmark, to 20 mSv. In 2012, it fiddled with the numbers again.
On June 2, the ministry announced it would no longer include Covid-19 patients waiting for admittance or treated in “general beds” that are not registered as coronavirus-specific when determining bed occupancy. The new guideline decreased the number of stage 4 prefectures with a bed occupancy over 50% from 20 prefectures to 11. The hospital bed occupancy rate is one of several indicators the Japanese government uses to monitor the pandemic and issue or revoke state of emergency orders.
A medical advisor to the ministry has said the Olympics should not commence if Japan is in stage 4 of the pandemic. Therefore, the government and the Japanese Olympic Committee are desperate to ensure that Tokyo and its neighboring prefectures ranked below that most severe category. However, it seems the Olympic organizers are more interested in window-dressing the problem than utilizing the ministry’s data to take life-saving proactive measures.
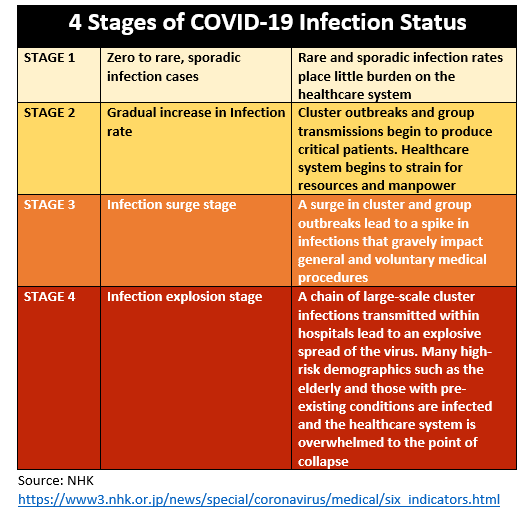
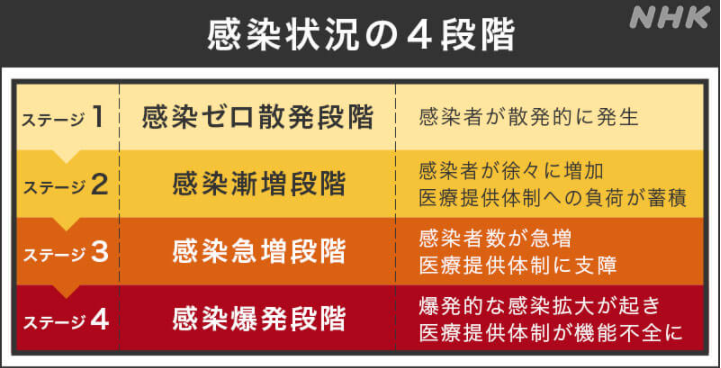
English translation of Japan’s four infection stages of the pandemic. Nine out of the 20 prefectures categorized as stage 4 before the criteria revision were improved to stage 3 this week.
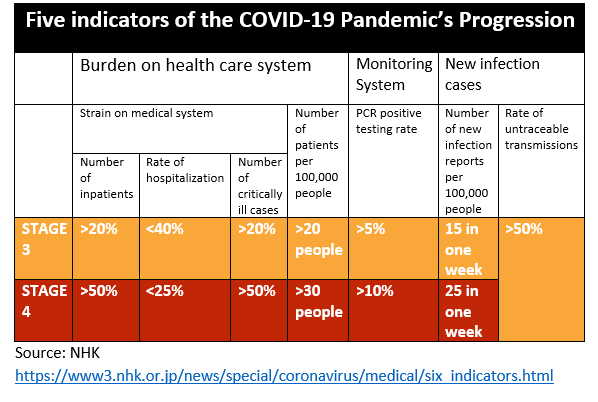
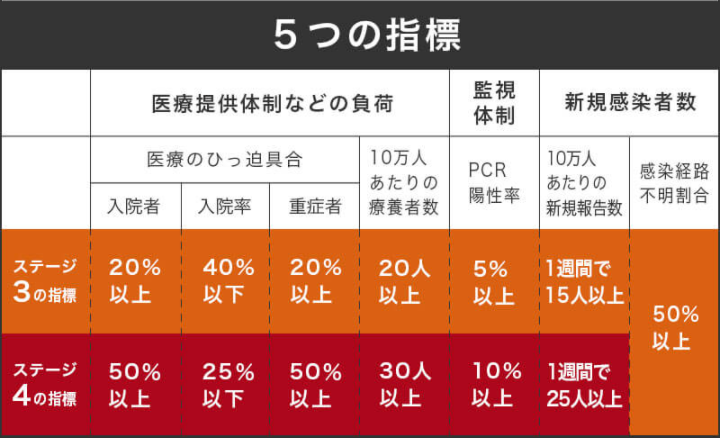
English translation of Japan’s five indicators used to monitor the pandemic’s progression.
How The Magic Works!
The Ministry of Health, Labor and Welfare publish weekly reports tracking the key variables used to categorize and document citizens recovering from Covid-19. Hospital bed occupancy rates express the personnel and resource demands placed on the healthcare system.
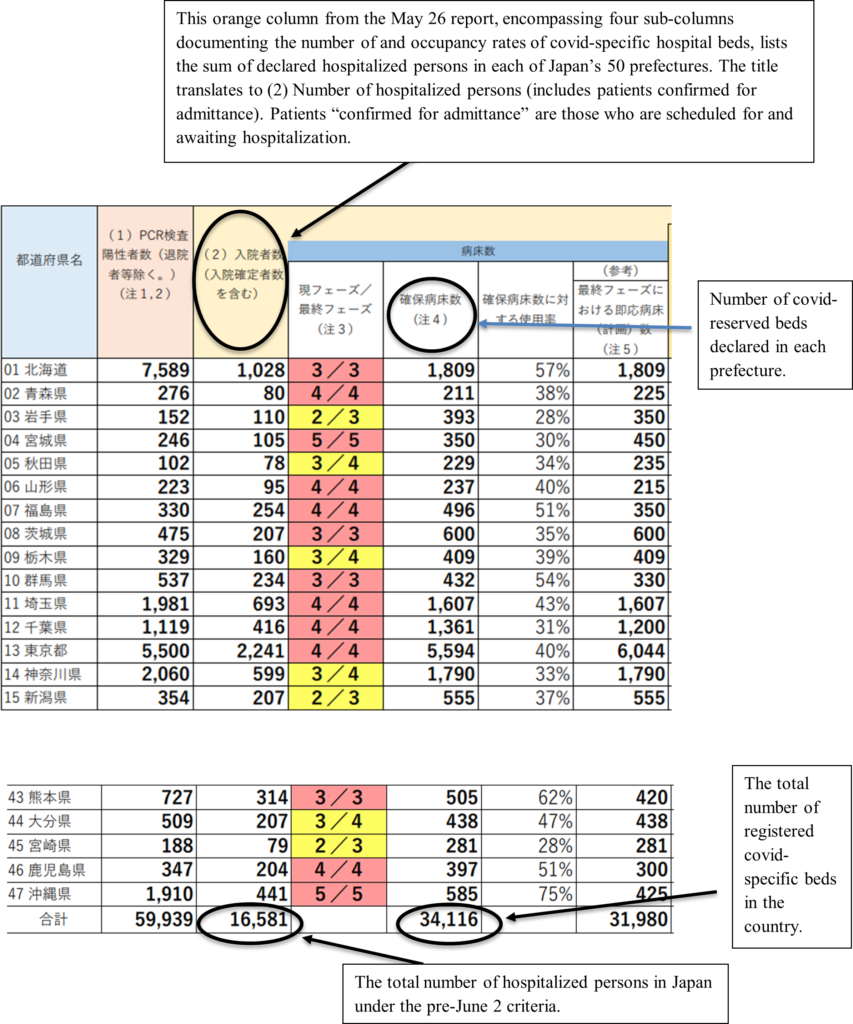
Last week’s report displaying data collected as of May 26, tallied the national total of Covid-19 hospitalizations at 16,581 and the number of covid-reserved beds at 34,116. Based on the calculation criteria at the time, Japan’s national bed-occupancy rate was 48.6%, dangerously close to the stage 4 threshold of 50% and above. This pre-revision report defined the number of “hospitalized persons” as the sum of patients admitted and awaiting admittance. The shortage of beds has created a waitlist for space. In covid-overwhelmed regions, those determined by doctors as requiring inpatient care must convalesce at home while waiting for a vacancy.
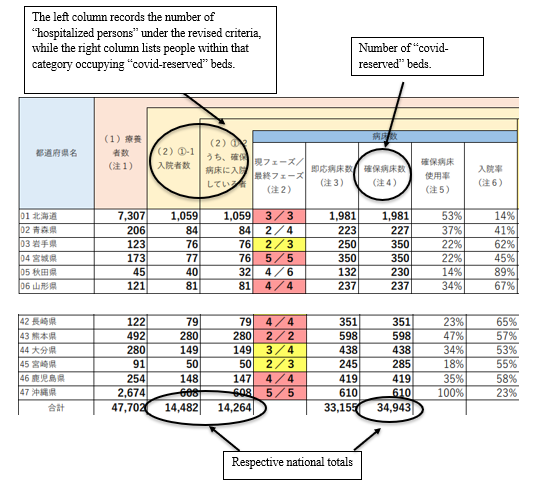
The post-revision survey created using data collected as of June 2 no longer included patients not yet admitted in the “hospitalized persons” category. The document further treats the total number of hospitalized persons as separate from patients occupying “covid-reserved” beds with the bed-occupancy rates calculated using the latter value.
Specifically, the total number of covid-19 hospitalizations was 14,482, and 14,264 of those patients occupied 40.8% of the 34,943 covid-reserved beds. The report does not account for the remaining 218 patients. Whether they lie in “general beds” or other spaces are unknown.
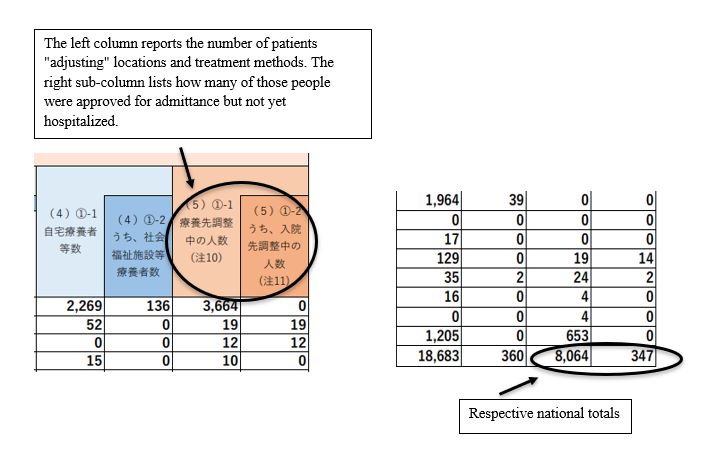
In addition, the June 2nd survey introduced several new data categories, including two columns for patients “adjusting” their treatment methods and locations. The main column reports that 8,064 people recuperating from Covid-19 were either “adjusting” their method of medical care, which can vary from staying home to emergency admittance, or their location of treatment. The adjacent sub-column clarified what can be considered an “adjustment” in treatment locations. Three hundred forty-seven people were recorded as “having confirmed hospitalization as their treatment method, but not secured admittance in a medical facility at the time of the survey.” Most likely, patients “confirmed for admittance” but waiting for a bed were regrouped into this “adjusting” classification.
Chief Cabinet Secretary Katsunobu Kato said in the June 7th press conference that the revision aims to nationally unify the calculation method for bed occupancy rates, which previously varied between prefectures. According to Kato, previous reports that considered patients recuperating in “general beds” as “hospitalized persons” did not include the number of occupied “general beds” in the total “covid-reserved” bed tally. He said this skewed the occupancy rates, making some regions appear more medically strained than they were. Kato said the revision would provide a more accurate reflection of Japan’s healthcare system.
The question that many people are asking is the Ministry trying to accurately reflect the state of Japan’s healthcare system or trying to massage the numbers to make it look as if everything is fine. With Japan holding the Olympics in less than 50 days, it seems like a blatant attempt to make things appear better than they.
Failing to account for new data point additions in the denominator of an average calculation can misrepresent the relationship of the share in question to the total whole. However, in pre and post revision reports, the relative burden placed on Japan’s hospitals were measured in terms of total “bed numbers.” A more appropriate revision could have broadened the definition of “covid-reserved” beds to include all occupied covid patients. Furthermore, the ministry could have established a separate category that registered patients awaiting admittance or treated in “general beds” as a surplus that hospitals could not treat with their designated resources.
Excluding patients from an indicator used to judge whether a state of emergency should be declared fails to understand that those omitted from the ministry’s category are spillovers from a healthcare system that is nearing collapse.
The “covid-specific” bed occupancy rate is irrelevant if hundreds of patients requiring medical attention are left at home, awaiting treatment, or invisibly recovering on an unregistered mattress.
Is there a Japanese version of this article?
Nope unfortunately. But you can see the Japanese source materials if you look.
Thanks for the interesting read! Are there any plans to also cover Japan’s vaccination numbers?
I’ve heard from several people now how Japan administeres more than 1 million shots per day according to the official numbers on the website of the Prime Minister’s Office of Japan. But looking at the official PDFs on the very same website I get a different picture and am wondering if I’m missing something here.
While it is true that for June 14 they list 214,965 doses for medical workers and 1,138,252 doses for the elderly for June 14, those numbers deviate from the numbers given in the PDFs. I followed the numbers for a few days by now and for medical workers the numbers on the website and the PDF always align but they only release new numbers for weekdays which also means that Mondays include the numbers for the weekend as well as the day following a holiday including the holiday’s number.
For the elderly it appears to be a little bit more complex from what I can tell. They apparently don’t always get accurate numbers for the elderly and update the PDF accordingly. On their website they include the updated numbers for all the other days though. I wasn’t able to follow the numbers on the weekend but for June 12 the PDF listed 603,478 doses for June 8 while the newest one from June 15 lists 680,995 doses for the same day. They usually update those numbers daily and add the increase to the corresponding date but on the website they simply add any increase on any other day to the big total for the last day without making any distinction. So the 1,138,252 on the website actually includes 521,160 new doses from June 14 and 617,092 doses that were added to the respective days before.
Do you guys know why they seem to be releasing the numbers that way and I’m just missing something here? I know that they promised administering 1 million doses per day back in May, so I hope it is not just some magical math again to make it seem like they reached their goal.
They are updating the numbers as time goes by since there’s a lag in reporting and processing due to the lack of digital record keeping. My own vaccine data appears to have been written on a sheet of paper and faxed somewhere rather than put directly into a computer system. There’s a possibility that about 17% of the nation is fully vaccinated by the time the Olympics begins.